NAEP results were released today, and the unsurprising takeaway is that Arkansas’ scores declined. The declines generally track with those seen nationally.
The NAEP tests are given to a sample of students in each state in the nation. Students are tested in math and reading in the fourth and eighth grades. Arkansas 3,500 Arkansas public school fourth graders and 3,600 eighth graders in 176 Arkansas had approximately 10% of its fourth and eighth grade students tested in math and reading from January through March 2022 in 176 school buildings across the state. NAEP is administered nationally to a representative sample of students from all 50 states, so acts as a standard measure of student performance across states and time.
We present NAEP performance since 2003, when administration became consistent. We dug into the new results and are pleased to share 5 NAEP nuggets with you. Note: We will dig deeper into differences in NAEP scores for various student groups on Wednesday.
NAEP Nugget #1: Scores have been declining since 2013
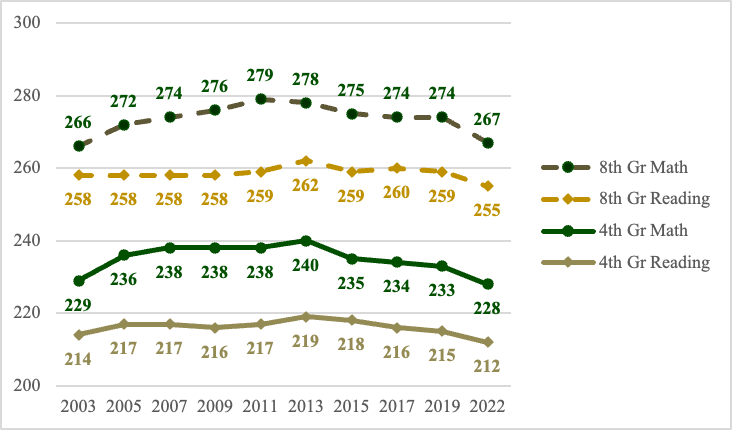
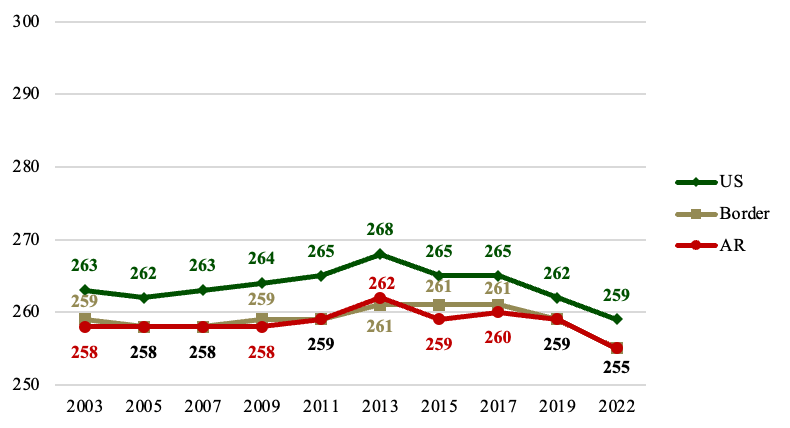
Arkansas’ 2022 NAEP scores were lower, but our scores had been moving downward for the past decade. In fact, as the figure below highlights, Arkansas scores were the highest in 2011 and 2013, and demonstrate declines since.
Figure 1: Arkansas NAEP Scores, 2003-2022
NAEP Nugget #2: Not Keeping Up With the Neighbors in Math
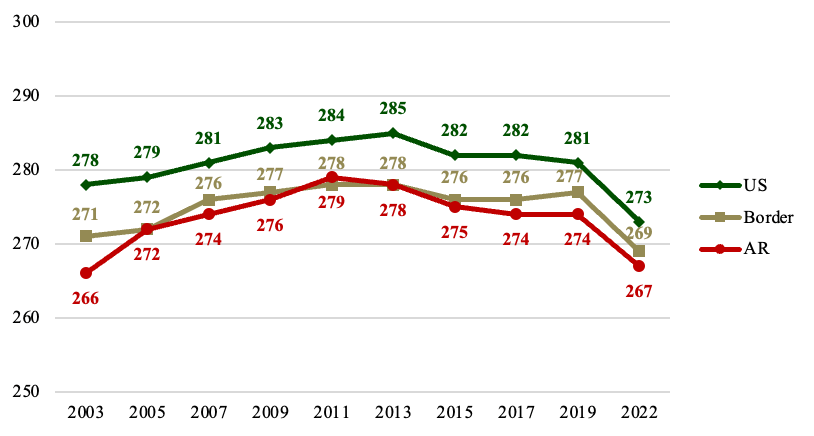
4th and 8th grade Math scores are lower than those of Arkansas’ border states (this group includes Louisiana, Mississippi, Missouri, Oklahoma, Tennessee, and Texas). This is particularly a bummer in 4th grade because we outperformed them from 2005 to 2013, and while the border states’ average scores are rising, Arkansas’ are declining. It’s also a bummer because we seem to be falling farther and farther behind.
Figure 2: 4th grade NAEP Mathematics Scores, Arkansas, Border States, and US, 2003-2022
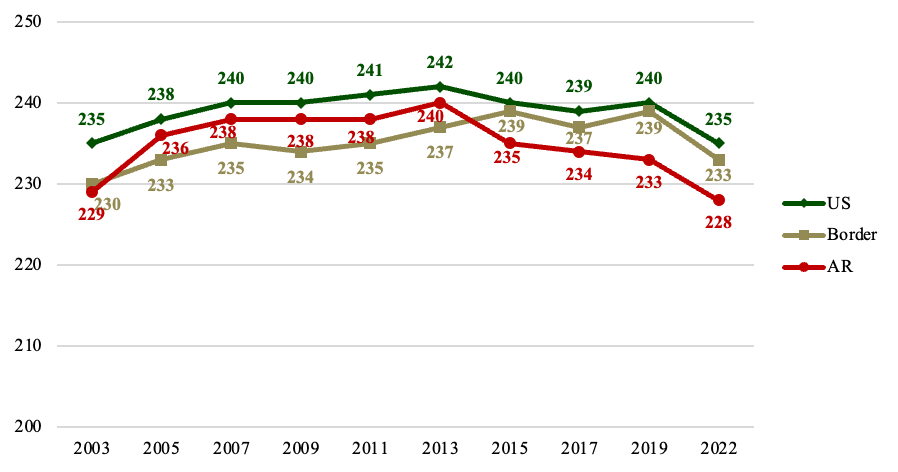
Figure 3: 8th grade NAEP Mathematics Scores, Arkansas, Border States, and US, 2003-2022
NAEP Nugget #3: In the Same Boat in Reading
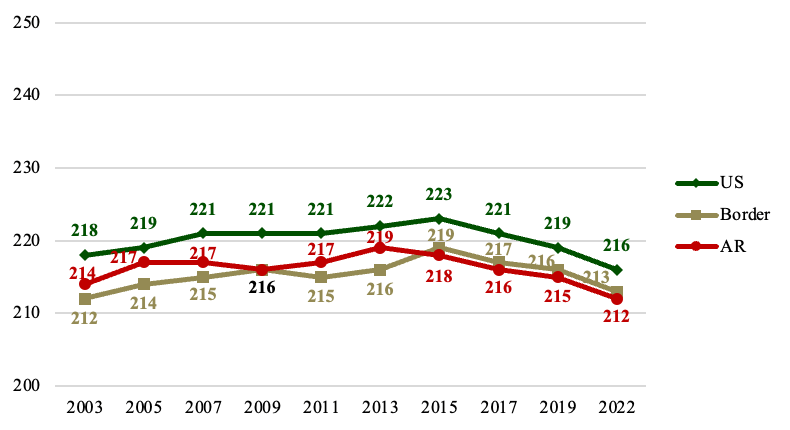
4th and 8th grade Reading scores are also lower than those of Arkansas’ border states, but we seem to be tracking the national performance pattern. Again, this is particularly a bummer in 4th grade because we outperformed them from 2003 to 2013.
Figure 4: 4th grade NAEP Reading Scores, Arkansas, Border States, and US, 2003-2022
When it comes to 8th grade reading has been relatively stable over time. Arkansas has been performing similarly in 8th grade reading as our border states and mirroring the changes seen at the national level. In 2022, 8th grade reading scores decreased for Arkansas, our border states, and the nation as a whole.
Figure 5: 8th grade NAEP Reading Scores, Arkansas, Border States, and US, 2003-2022
NAEP Nugget #4: Gaps for Students in Poverty
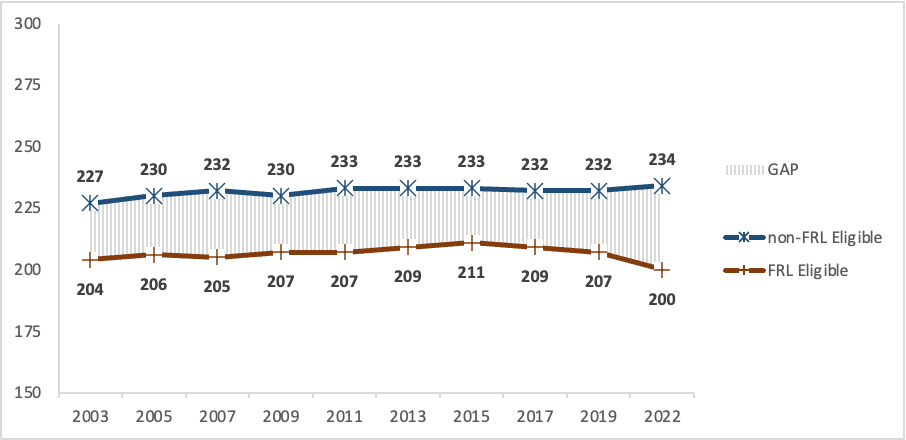
Prior to 2022, score gaps between Arkansas students eligible for Free/Reduced Lunch (a proxy for economic disadvantage) and their peers who are not eligible continued to widen. The 2022 results, however, reveal more variation. For example, as shown in the figure below, in 4th grade reading scores increased 2 points for more economically advantaged students, and decreased 7 points for students from lower-income households, and therefor the size of the gap increased.
Figure 6: FRL and Non-FRL Eligible Students’ 4th grade NAEP Reading, Arkansas, 2003-2022
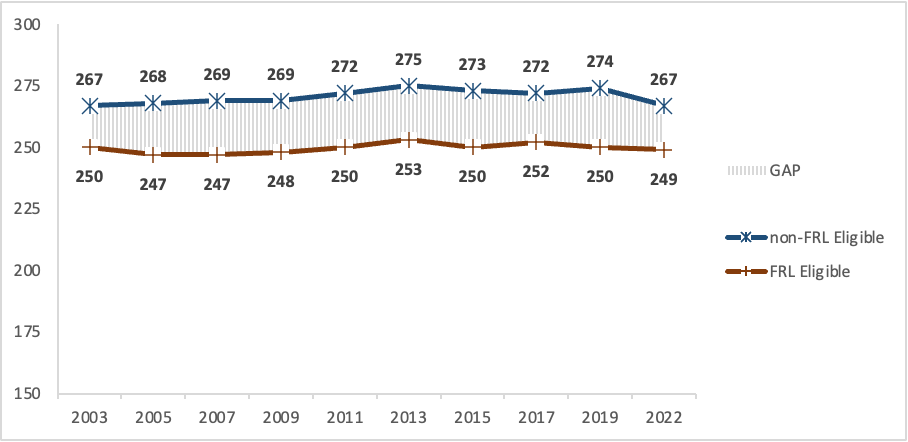
In contrast, gaps in 8th grade reading between FRL and Non-FRL students are smaller than they have been since 2003. This decrease in the gap is due to the decline in non-FRL students’ reading scores.
While there was much discussion about how school closures were more damaging to students from less advantaged backgrounds, these results indicate Arkansas’ less advantaged students are performing similarly to prior trends.
Figure 7: FRL and Non-FRL Eligible Students’ 8th grade NAEP Reading, Arkansas, 2003-2022
NAEP Nugget #5: Mixed Messages
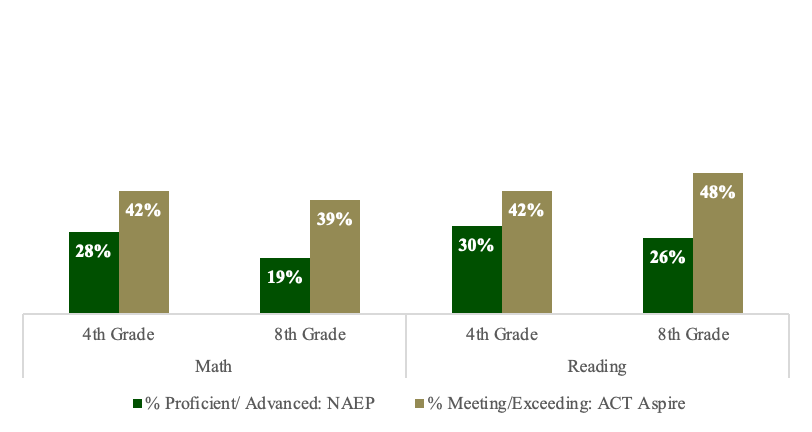
Proficiency rates on NAEP math and reading assessments are lower than on ACT Aspire, Arkansas’ assessment used to measure student achievement. ACT Aspires finds 12-14 percent more 4th graders scoring proficient than NAEP. In 8th grade, the discrepancy is 20 percentage points in Math and 22 in reading.
Figure 8: Arkansas NAEP Proficiency vs. ACT Aspire Proficiency, Math and Reading, 4th and 8th grade, 2022
National assessments like NAEP provide a common measuring stick for student performance, which is particularly important as Arkansas is the only state administering ACT Aspire statewide in grades 3-10. We need to pay careful attention to the differences between the NAEP and ACT Aspire proficiency rates. Arkansas will be administering ACT Aspire through 2024 and when we send and receive conflicting messages about how well our students are performing, it can make it difficult to determine how well our students are doing and which sorts of educational interventions are making a difference for our students.
Three measures of Arkansas’ academic achievement (NAEP, ACT Aspire, and ACT) were all essentially flat at the state level for the 3 to 4 years prior to the pandemic. The post-pandemic declines in achievement were substantial, although similar to those seen in other states, and scores have been slow to recover.
During this time the state has consistently increased per pupil funding, invested in literacy training, re-created school accountability systems, moved to universal ACT testing for juniors, refocused teacher and principal evaluation, and much more. Maybe we haven’t allowed enough time to see the results of the changes we have been making in education. Or maybe those changes aren’t really having an impact at the school level. Or maybe the changes ARE working, and these measures just aren’t capturing the improvement.
Or maybe we need to step back, and look at school-level academic growth instead of statewide achievement to see something worth cheering about! Stay tuned for the upcoming release of the 2002 OEP awards to see if your school makes the list of schools that are demonstrating success in increasing student learning!