Here at OEP, we get this question a lot! While we are waiting for ESSA scores and letter grades to be released later this month, we thought we would take the opportunity to dig into the data behind the ESSA Index score and subsequent letter grades.
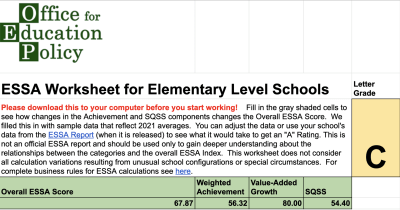
If you already know about the ESSA components, you know that calculating the ESSA scores use to assign letter grades is a complicated procedure, which is likely why we often get asked What Would it Take for My School to Get an “A”? To help you figure it out, OEP has created a quick Do-It-Yourself ESSA calculator so you can see the impact of changing various outcomes. If you want to get more detailed, we also created a more in-depth version that will allow you to play “what-if” with all the various indicators.
If you are a school leader with access to the pre-release ESSA reports, you can make use of these workbooks right away. For the rest of us, we look forward to the release of ESSA data on or around November 14th.
If you aren’t as familiar with ESSA, there are three components of the annual ESSA scores for elementary and middle schools: Achievement, Growth, and School Quality/Student Success. High schools’ scores also include Graduation Rates. You can read the details for specifics on how each of these indicators are calculated.
Today we are going to focus on Achievement and School Quality/Student Success.
The Achievement Score is a familiar measure of student performance that reflects how well students in each school perform on the state’s annual exams in ELA and Mathematics. Schools are awarded 0 points for students that perform at the lowest level, a 1/2 a point for each student nearing grade-level expectations, and 1 point for students meeting or exceeding grade-level expectations. While meeting grade-level standards is important, there is clear connection between the demographic and programmatic characteristics of students served by the school and the percentage of students performing at grade level. Schools serving more advantaged students typically receive “good” scores because a high percentage of their students pass, while schools serving a larger percentage of students who live in poverty, participate in special education, or are learning English often receive lower scores because a higher percentage of their students are not yet performing at grade level.
The School Quality/ Student Success Indicator Score (SQSS) includes a variety of measures including student attendance, the percentage of students reading at grade level, and student achievement and growth on the annual science assessment. In addition to these measures, high school scores also reflect student enrollment in advanced courses, computer science courses, and community service learning as well as student performance on the ACT college-readiness exam and student GPA. It is important to note that many of the indicators included in SQSS such as reading at grade level, enrollment in advanced courses, and performance on college-readiness exams are less likely for students who live in poverty, participate in special education, or are learning English.
So, how (and why) do these scores turn into Letter Grades for schools?
All these data points get combined into an overall score for each school, which can be confusing for parents and guardians to interpret. Arkansas, like a number of other states, created an easy-to-understand representation of overall school quality: A-F letter grades.
Based on the Overall ESSA Score, schools are assigned a letter grade. The cut-points were set in 2018, and vary somewhat by the grades served by the school. Here at OEP, we support the idea of an understandable metric for communicating school quality to parents, but we are concerned that the way the letter grades are calculated is sending the wrong message to parents.
Tune in next week to learn more about why Growth Scores are so important and how they impact ESSA scores and letter grades.