Back in May we dug into the brand-new school-level spending data in two blog posts. In our first post we showed that Arkansas’ schools spend most of their money on people (76%) and instruction (56%). We also showed that schools with higher poverty levels, as measured by Free and Reduced-Price Lunch (FRL) percentage, tend to spend more.
Our second post broke the spending data out by school level (i.e., elementary, middle, high). We found that Arkansas spends far more per pupil on high school than it does on elementary and middle school (i.e., >$1,000 more per pupil). Somewhat surprising to us, we also found that Arkansas spends the least on middle schools.
In this post, we compare school-level spending between traditional schools and open-enrollment charter schools. For the remainder of the post, we will refer to open-enrollment charter schools simply as charters or charter schools. Arkansas also has district conversion charter schools, which are traditional schools that have been provided with additional flexibility, but they are funded in the same way as traditional schools. Conversion charter schools are treated as traditional schools for our analysis.
Both traditional schools and charter schools receive funding through the state funding formula. However, local property taxes cover a portion of traditional schools’ per pupil funding amount as determined by the formula, and traditional districts have the ability to raise additional dollars if voters approve higher property tax rates. State-level taxes fill in the gap between the formula funding amount and the amount traditional districts raise through property taxes, increasing funding equity between wealthy and poor districts.
Charter schools, on the other hand, do not have geographic attendance zones, and thus cannot raise local property tax revenue. Charters’ per pupil formula funding amount is fully covered through state-level taxes.
The inability of charter schools to access local property taxes can create big differences in expenditures between traditional schools and charter schools. Facilities funding is often a big driver of these differences. A large proportion of traditional districts’ funding for facilities comes from local property taxes, and state and philanthropic funding for charter facilities generally falls short of the amount traditional districts spend on building projects. This post will not dig into the particulars of Arkansas school facilities funding, but will instead focus overall differences and the expenditure categories we presented in our earlier posts. In the coming weeks, will likely follow up with a post devoted to charter facilities funding.
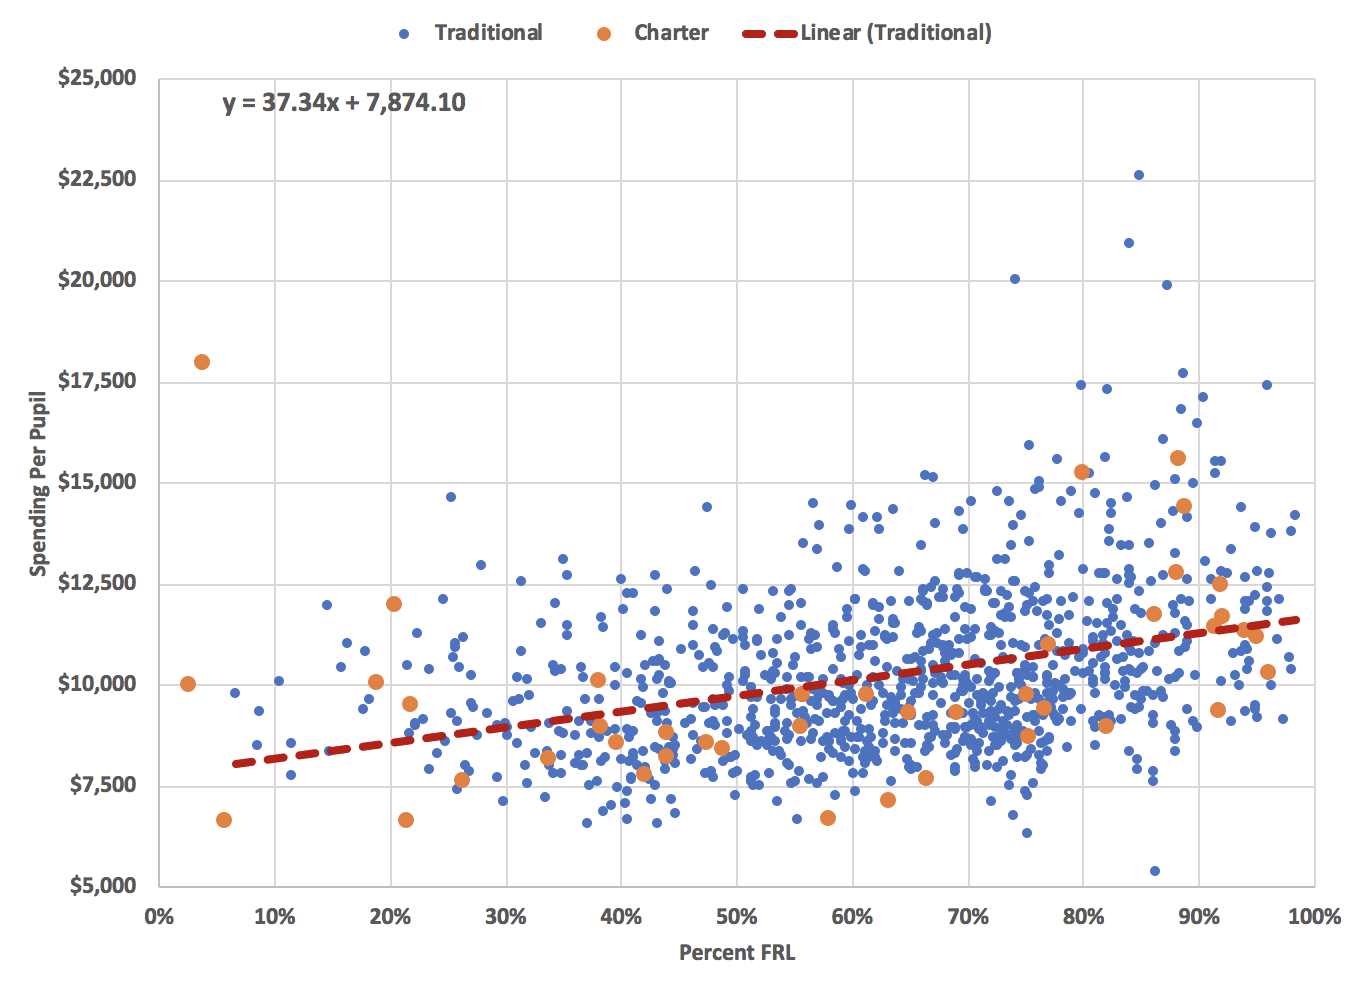
Arkansas currently has 25 open-enrollment charter school districts comprised of 49 individual schools. Charters make up only about 5 percent of schools in the state, educating around 3 percent of students. Figure 1 below shows a scatter plot of school-level spending versus the percentage of students eligible for the Federal Free and Reduced-Price Lunch (FRL) program. Charter schools are represented by the orange circles. Charter schools are scattered throughout the plot, and do not deviate significantly from the overall spending vs. FRL trend we showed in our first post.
Figure 1: Scatter Plot of 2017-18 School-Level Spending Per Pupil vs. Percent FRL
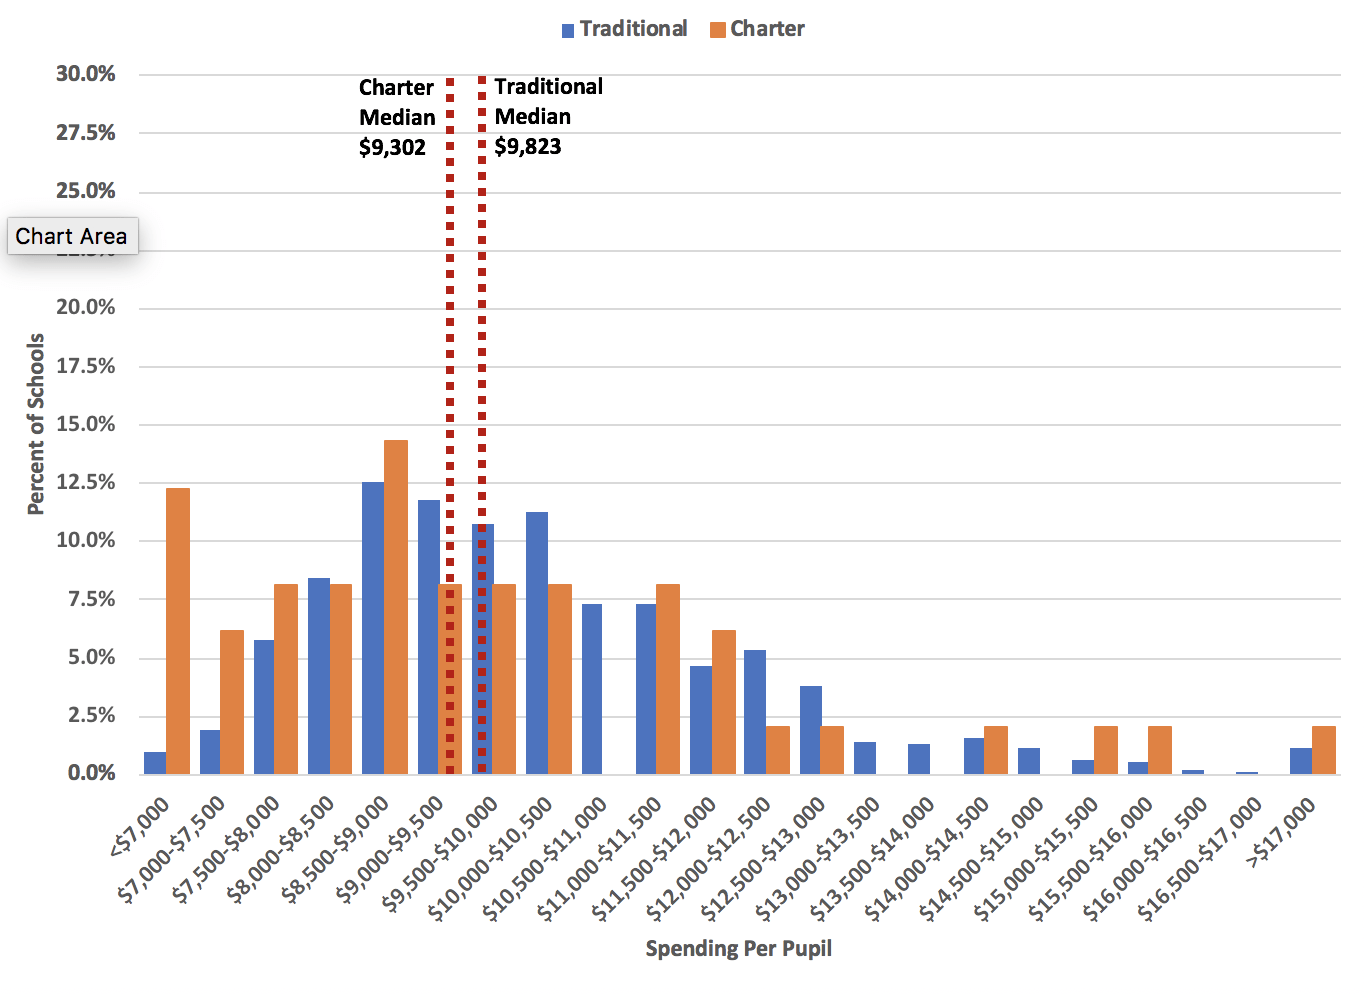
While the scatter plot above shows that charter schools closely resemble traditional schools in terms of expenditures and percent FRL, there are some differences in spending levels. Figure 2 illustrates the distribution of school-level spending for both traditional and charter schools. In the 2017-18 school year, the median charter school spent $521 less per pupil than the median traditional school. The difference in the median school’s per pupil spending is largely driven by the 6 charter schools (12 percent of charters) that spent less than $7,000 per pupil, otherwise the distribution of spending per pupil looks similar between traditional and charter schools.
Figure 2: 2017-18 Total Spending Per Pupil
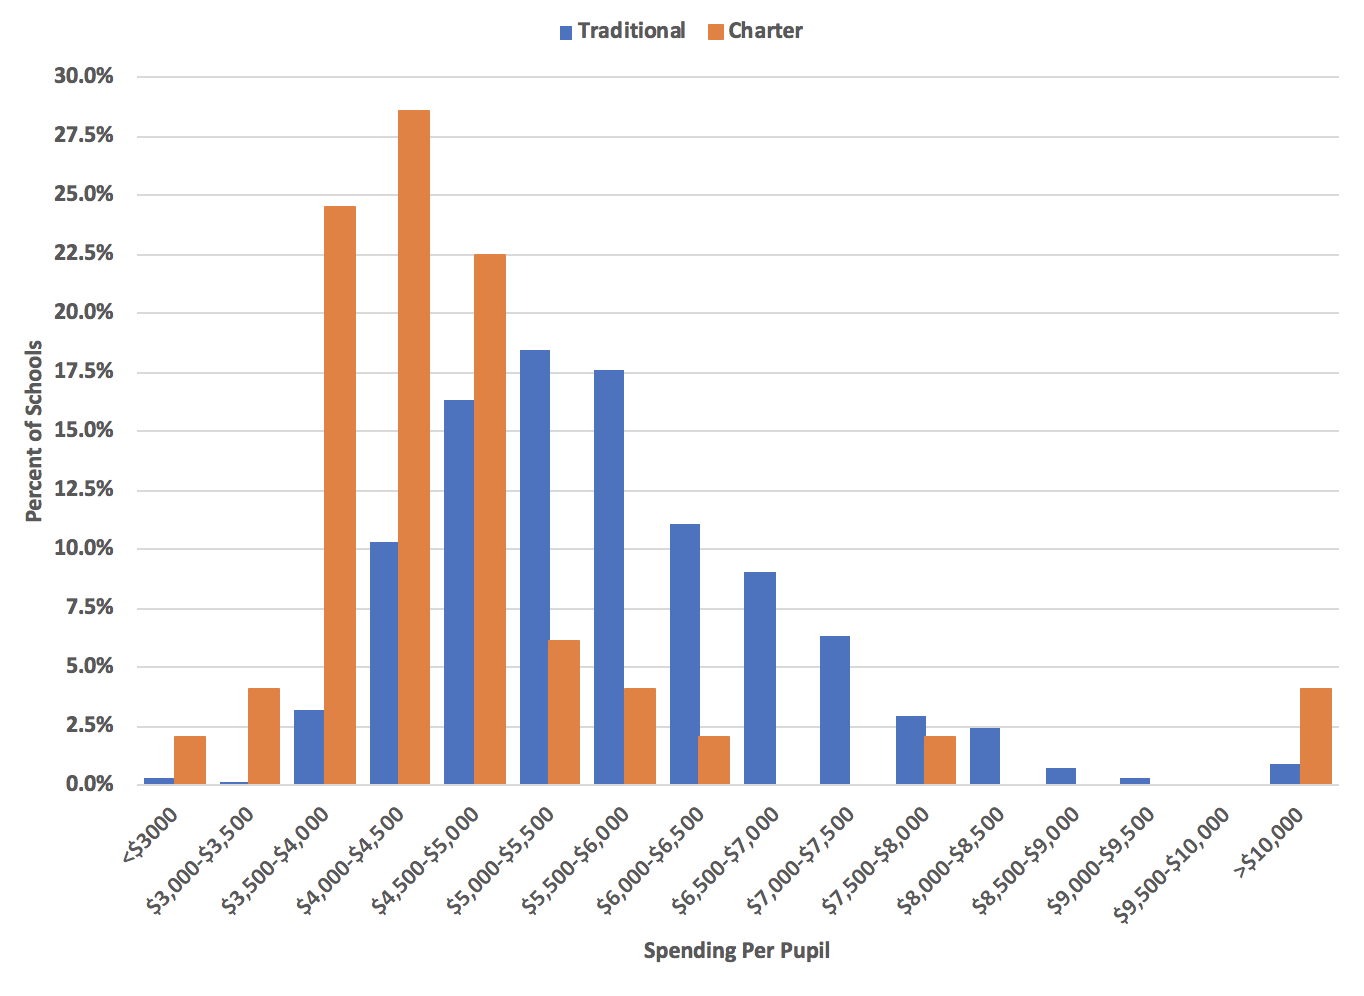
While overall expenditures look quite similar, there are interesting differences in how charter vs. traditional schools spend their dollars. As we did in our earlier posts on school-level spending, we can also break spending out by activity/purpose. Figure 3 shows the distribution of per pupil spending for instruction, which includes things like teachers’ salaries, books, etc. In the 2017-18 school year, the median charter school spent $4,364 on instruction while the median traditional school spent $5,520, a difference of $1,156 or about 20 percent compared to the median traditional school. Since the majority of instructional expenditures are for teacher salaries which are linked to experience, it’s likely that charter schools’ lower average teacher experience is a big driver of this expenditure difference.
Figure 3: 2017-18 Per Pupil Spending for Instruction
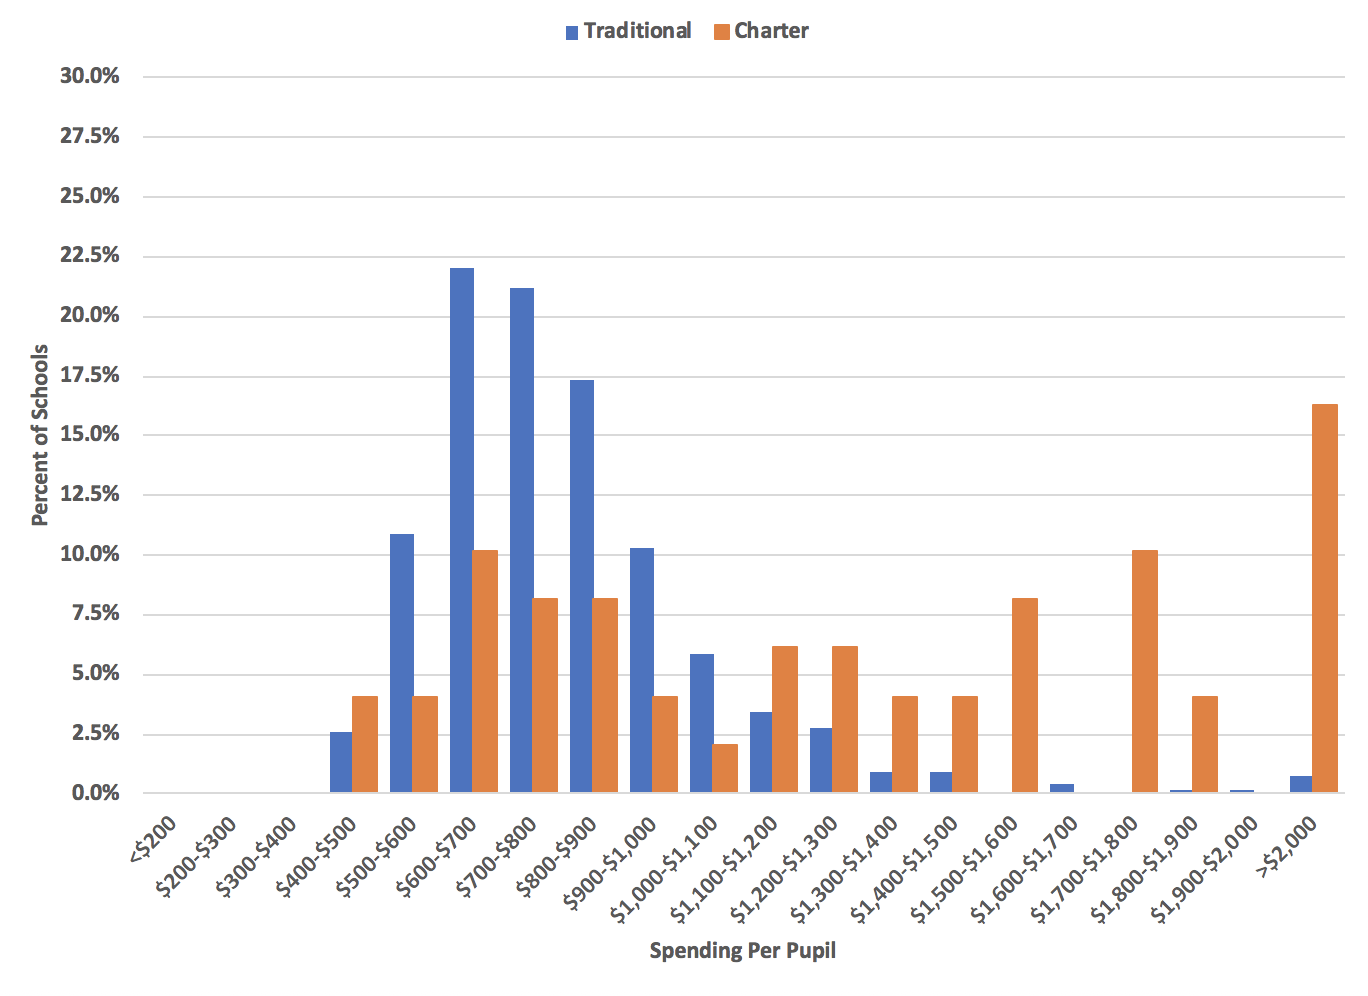
Charter schools spent less on instruction, but more on administration. Figure 4 provides the distribution of per pupil spending on administration. The median traditional school spent $760 per pupil on administration, including both school and central administration costs, while the median charter spent $1,241, a difference of $481 or about 60 percent compared to the median traditional school. The difference in administration expenditures is not very surprising given the fact that several charter schools are still starting up and the median charter school is about 40 percent smaller than the median traditional school. New charter schools generally start small and grow over time, but school leadership needs to be in place from the beginning. Because administration costs are spread over a smaller student base early on, administration costs are often higher per pupil in a school’s startup phase.
Figure 4: 2017-18 Per Pupil Spending for Administration
Charter schools spent more on student support services like physical and mental health services, guidance counselors, etc. and less on instructional staff support like teacher professional development. Figure 5 shows the distribution of expenditures on student support services. The median traditional school spent $483 per pupil and the median charter spent $398, a difference of $85 or 20 percent compared to the median traditional school.
Figure 6 illustrates the distribution of expenditures for instructional staff support. The median traditional school spent $716 per pupil on instructional staff support while the median charter spent $438, a difference of $278 or 40 compared to the median traditional school.
Figure 5: 2017-18 Per Pupil Spending for Student Support Services
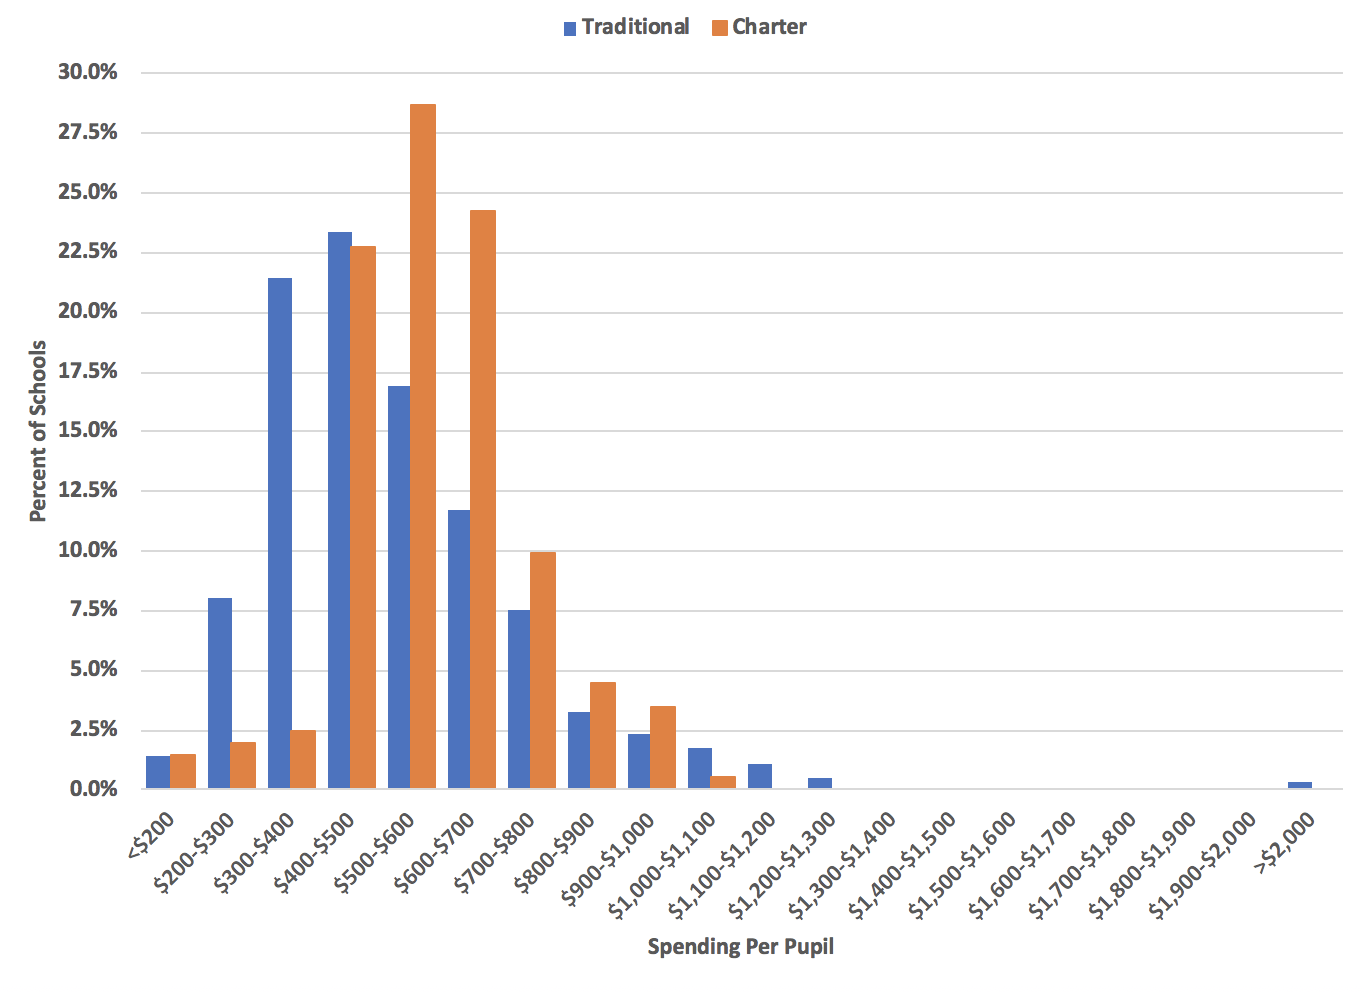
Figure 6: 2017-18 Per Pupil Spending for Instructional Staff Support
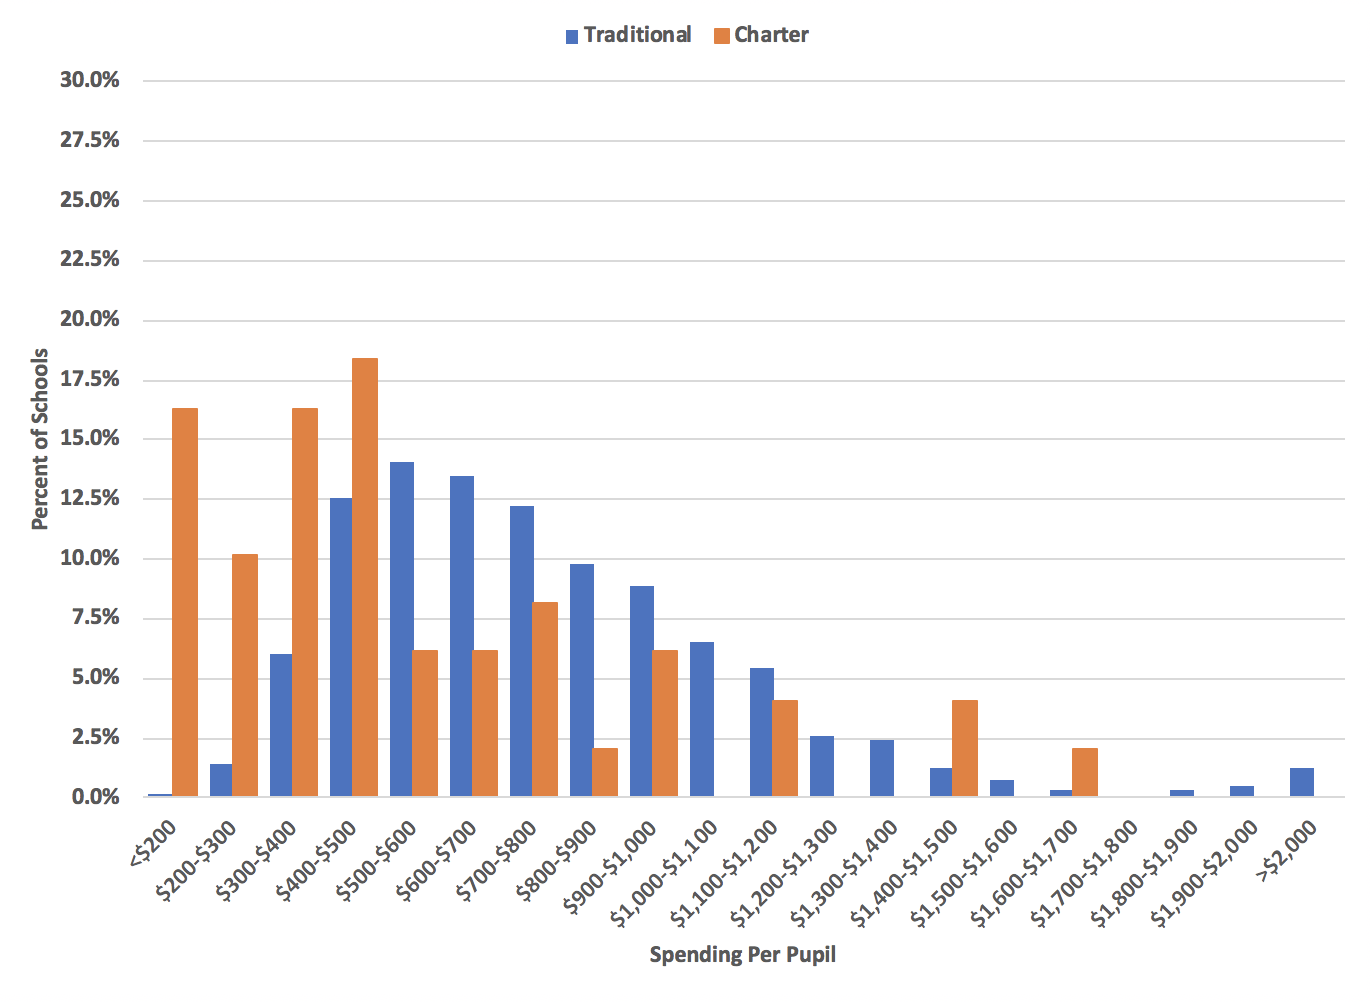
Overall traditional school and charter school expenditures per pupil are quite similar; however, there are interesting difference in how they spend those dollars. In the 2017-18 school year, charters spent somewhat less on instruction, owing to their younger, less experienced workforce, but they spend more on administration. Charters also spent more on student support services but less on instructional staff support.
While the state funding formula largely determines the amount of funding schools receive, districts and schools have a lot of discretion around how those dollars are spent. The distribution charts above show that schools spend their dollars in a variety of ways, and the differences across traditional schools are generally bigger than the differences between traditional schools and charter schools. There is no “right” way to spend education dollars. The context and the student population matter a lot. That’s why we are big fans of local decision making as long as it is strategic and student focused.
