Data
School Recognition and Letter Grades
The Arkansas School Recognition database highlights the schools that have received financial awards based on their high achievement, high academic growth and high school graduation rates.
The Letter Grade Databases data for the given year highlights grades given to each school in Arkansas based on achievement, teacher qualification, retention, discipline and more. All data are publicly available through the Arkansas Department of Education.
2017-2023 GT Value Added Growth Scores
2023 Outstanding Educational Performance Awards: Highlighting Arkansas Schools Demonstrating High Student Growth
2022-2023 Recognition Data and Letter Grades
Value added (growth) scores for Arkansas Schools based on 2022-2023 Letter Grade Data (Excel)
Coming Soon: School Letter Grades!
School letter grades will be released soon, and here at OEP we wanted to share some information about what is included in the school letter grades, and what they mean for Arkansas’s schools and students.
Why are schools assigned letter grades?
A-F letter grades are intended to provide an indicator of school quality that is easy for parents and other stakeholders to understand. Letter grades were first assigned to Arkansas’s public schools in the 2014-15 school year. The grading system was updated for the 2016-17 school year when it was aligned to the state’s federal accountability systems.
What is included in the letter grade calculation?
Letter grades are based on a school’s overall score, which includes three main components: Growth, Achievement, and School Quality.
Here at OEP, we think the Growth Score is the most important measure of school quality. Growth Scores measure how much individual students at the school increase their achievement scores from year to year. Using growth as a measure of school success levels the playing field because all students are evaluated by the extent to which they grow from their own starting point; thus, students facing socioeconomic barriers to achievement have the same opportunity for growth as do their peers from advantaged backgrounds. Students who are well above grades level can also continue to grow their learning. Each and every student can grow their understanding, and we should expect all schools to foster student growth, regardless of family income, first language, or learning needs.
The Achievement Score is a familiar measure of student performance that
reflects how well students score on the state’s annual exams. Schools serving more advantaged students typically receive “good” scores because a high percentage of their students passed, while schools serving a larger percentage of students who lived in poverty, participated in special education, or were learning English often receive lower scores because a higher percentage of their students were unable to pass the test. While meeting grade-level standards is important, the clear connection between Achievement Scores and student demographics suggests that point-in-time test scores are not a good measure of how well a school is educating students, but rather a reflection of the wealth of the community being served by the school.
The School Quality/ Student Success Indicator Score includes a variety of measures, like student attendance, the percentage of students reading at grade level, and student achievement and growth on the annual science assessment. In addition to the measures used for elementary and middle level schools, high school scores also reflect student enrollment in advanced courses, computer science courses, and community service learning as well as student performance on the ACT college-readiness exam and student GPA.
If a school serves 12th grade students, the percentage of students who graduate from high school is also included in the calculation of the overall scores used to assign the letter grade.
What percentage of schools get “A”s? What Percentage get “F”s?
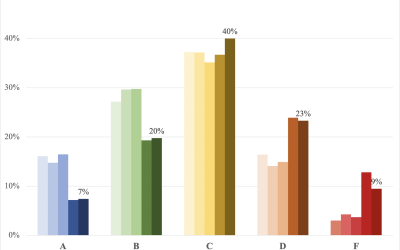
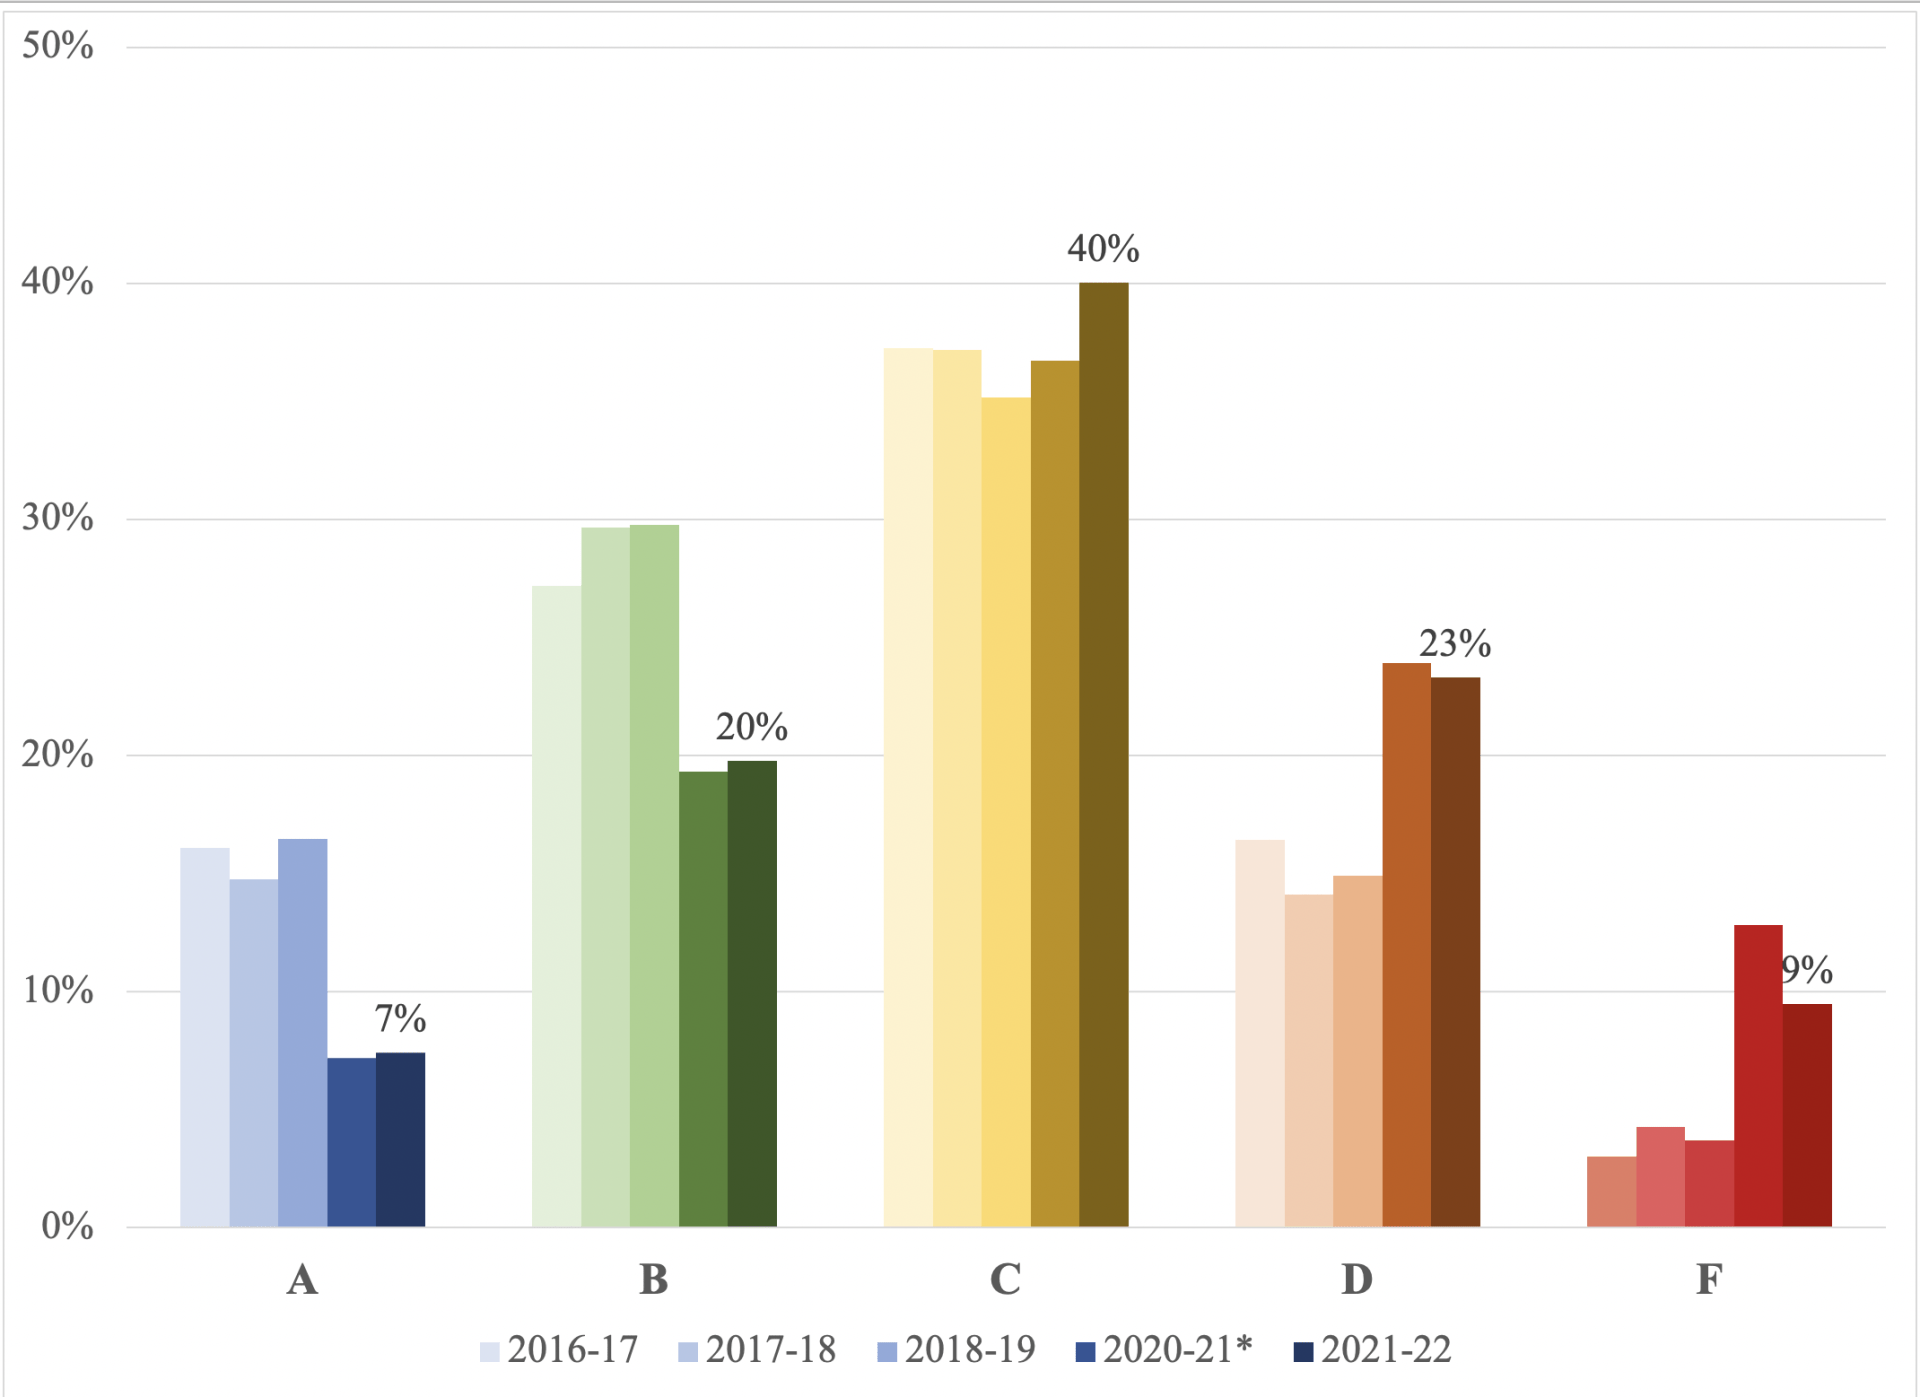
The figure below indicates the percentage of schools statewide that received each letter grade from 2016-17 through 2021-22. Due to COVID-related school closures in the 2019-20 school year, statewide assessments were not given to students and no letter grades were assigned. In 2020-21, although the state did not assign letter grades to schools, all needed data were available so OEP calculated what letter grade each school would have been assigned. The 2020-21 letter grades are marked with an asterisk* for this reason.
As presented in the figure below, prior to COVID, about 16% of Arkansas schools received an “A” letter grade, and 4% received an”F”. Post- COVID, only 7% of schools received an “A” grade, while 9% received an “F” in 2021-22. These trends in letter grades are due to state- and nation-wide declines in student achievement after COVID. While these changes do not reflect a post-COVID drop in the quality of schools in the state, they do highlight how much state letter grades are reflective of student achievement.
Figure 1. Arkansas’s School Letter Grades, 2016-17 through 2021-22.
What does a school’s letter grade mean for parents?
Starting this school year, parents or guardians of students who had attending an “F” rated school the prior year could exercise the option to use and Education Freedom Account to send their student to private school. Next year, that option will be available to parents or guardians of students who had attending a “D” or “F” rated school.
Stay Tuned to OEP to find out when the new letter grades are released and how your school performed! Next up: OEP Awards for high growth schools!
2021-2022 Recognition Data and Letter Grades
Value added (growth) scores for Arkansas Schools based on 2021-2022 Letter Grade Data (Excel)
2018-2019 Recognition Data and Letter Grades
Value added (growth) scores for Arkansas Schools based on 2018-2019 Letter Grade Data (Excel)
2017-2018 Recognition Data and Letter Grades
Value added (growth) scores for Arkansas Schools based on 2017-2018 Letter Grade Data (Excel)
2016-2017 Recognition Data and Letter Grades
Value added (growth) scores for Arkansas Schools based on 2016-2017 Letter Grade Data (Excel)
2015-2016 Recognition Data and Letter Grades
2015-2016 School Recognition Data (Excel)
Value added (growth) scores for Arkansas Schools based on 2015-2016 Letter Grade Data (Excel)
Contact Us
Phone: 479.575.3773
Fax: 479.575.3196
201 Graduate Education Building
The Office for Education Policy
Arkansas-focused education research for Arkansas’ education stakeholders. Let us answer your questions.
College of Education and Health Professions
University of Arkansas