As educators are ramping up for the new school year, OEP wanted to share some district-level information about the success of high school freshman. Today, we sent a custom Freshman Success Analysis to each superintendent. The short report reveals if the district’s ninth graders were more or less likely to pass all their freshman courses than similar freshman in the average Arkansas district.
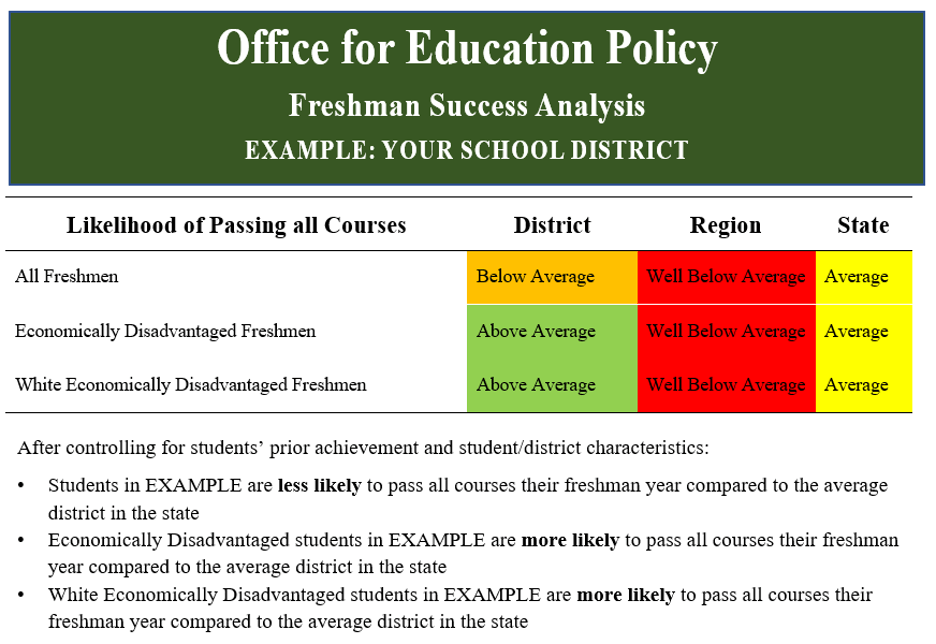
As you can see in the sample report above, we included the passing likelihood for three groups: all freshmen, economically disadvantaged freshmen, and white economically disadvantaged freshmen. We selected these groups because our statewide analysis identified that economically disadvantaged students were 9 percentage points less likely to pass all their freshman courses than their more advantaged peers with similar prior academic achievement. The likelihood of success was the worst for White economically disadvantaged, who were 13 percentage points less likely to pass all their freshman courses than their white non-economically disadvantaged peers with similar prior academic performance.
We were surprised to find such large differences in the likelihood of success between students who are similar in academic ability. To make the data understandable, we provide the relative likelihood of success (well above average to well below average) for these groups for the district, the region, and the state as a whole.
We know students enter high school with different academic skills, so when we predict the likelihood of a student passing all their courses, we statistically control for the student’s prior academic achievement from 7th and 8th grade ACT Aspire Math and ELA scores. We also factor in student demographic and programmatic characteristics. as well as district characteristics like size and percent of students that economically disadvantaged. In this way we can measure the differences in success between very similar students in each district. We know freshman year GPA is an important predictor for high school graduation and college enrollment, and we want to help all students have access to future opportunities.
The Freshman Success Analysis also includes:
- the top 10 courses that freshman in the district were most likely to fail, and
- failure rates by student demographic and programmatic characteristics.
This may be helpful descriptive information, but keep in mind that unlike the likelihood of success indicators,these rates do not control for students’ prior academic achievement.
If you are concerned about the information contained in your district’s Freshman Success Analysis, we recommend that you take the following steps:
- Evaluate what freshman grading looks like in your district/school
- Evaluate your district/school’s support systems in place freshman year and beyond
If you are concerned about inequities in freshman grading, reach out to OEP! We want to work with you to help implement and monitor changes. Policies that can help include enacting a “no-zero” and minimum grading policy and forming mentor relationships with students (more suggestions found here and from our ADE Summit presentation).
If you would like to discuss this further or just have questions, we are here to help. Please send us an email at oep@uark.edu.